DOBRE przykłady
Sector Report ABSL "Business Services Sector in Poland 2023”
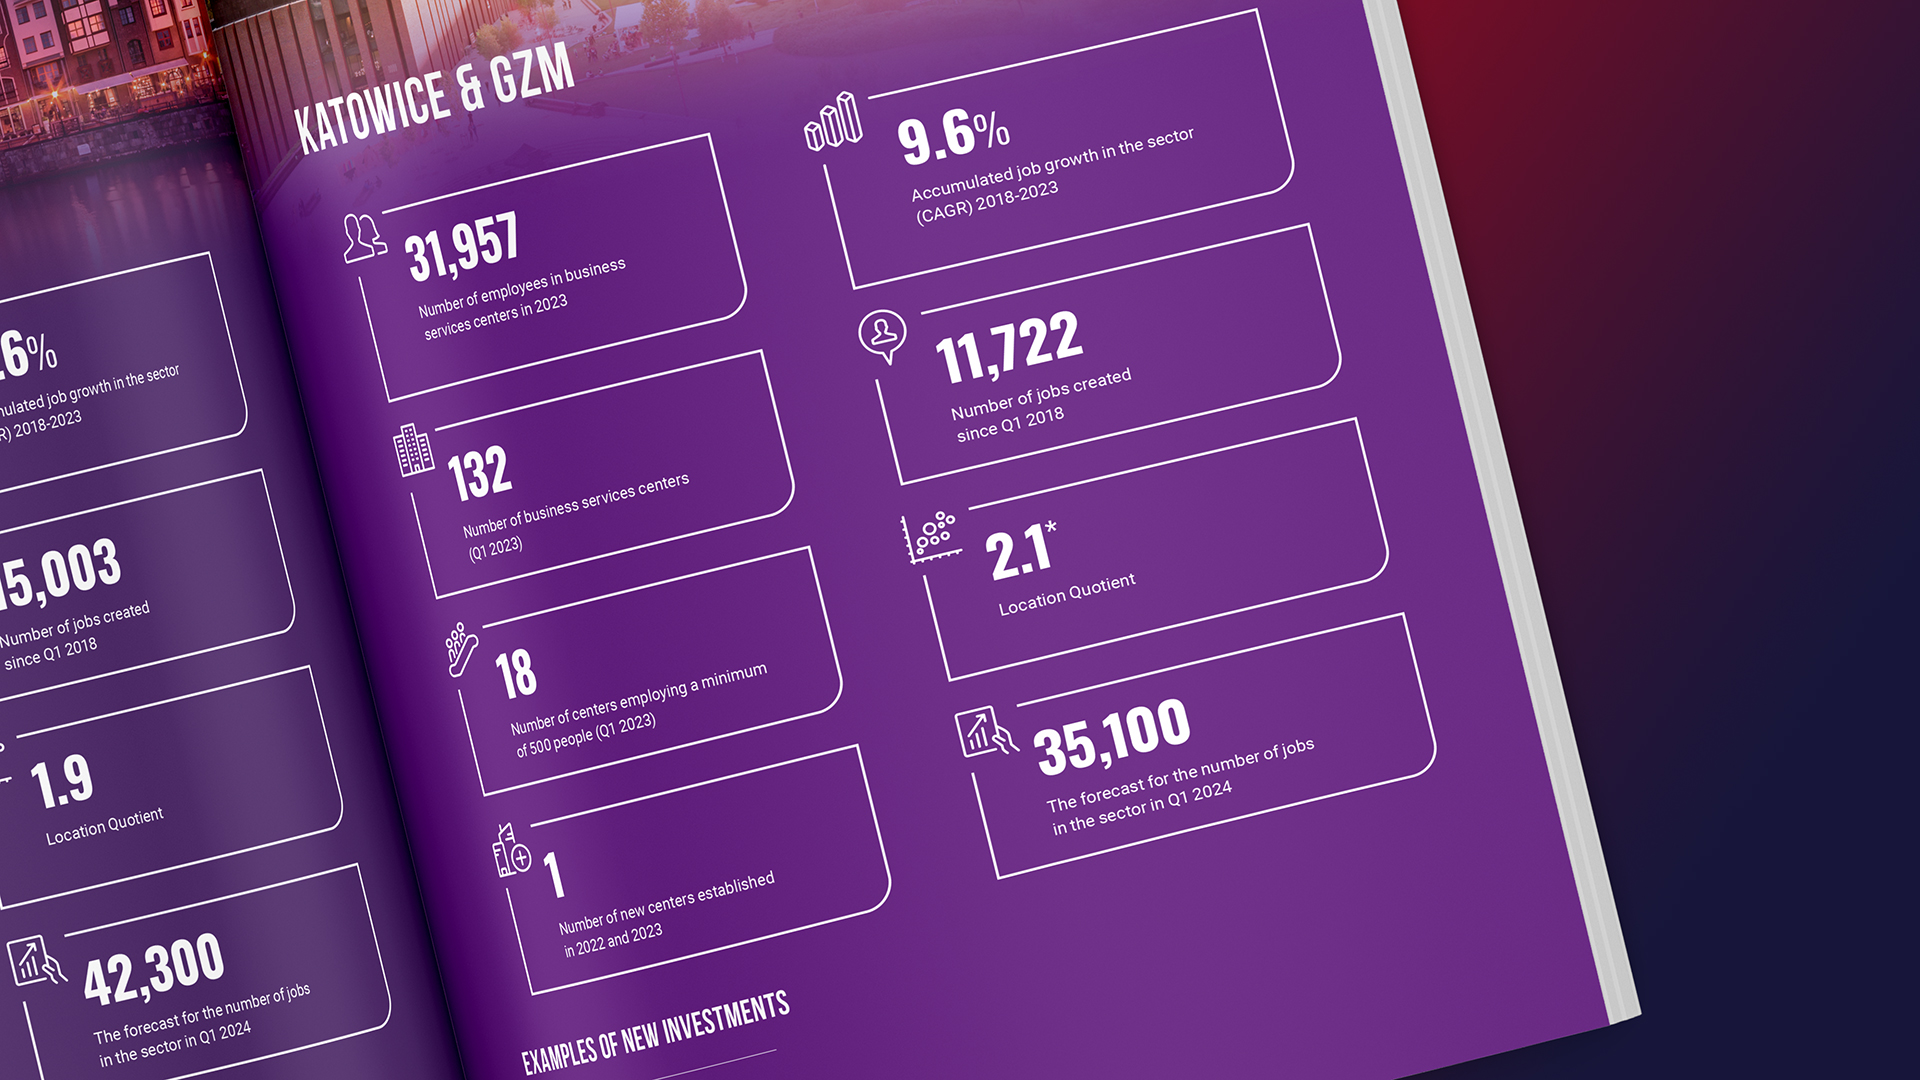
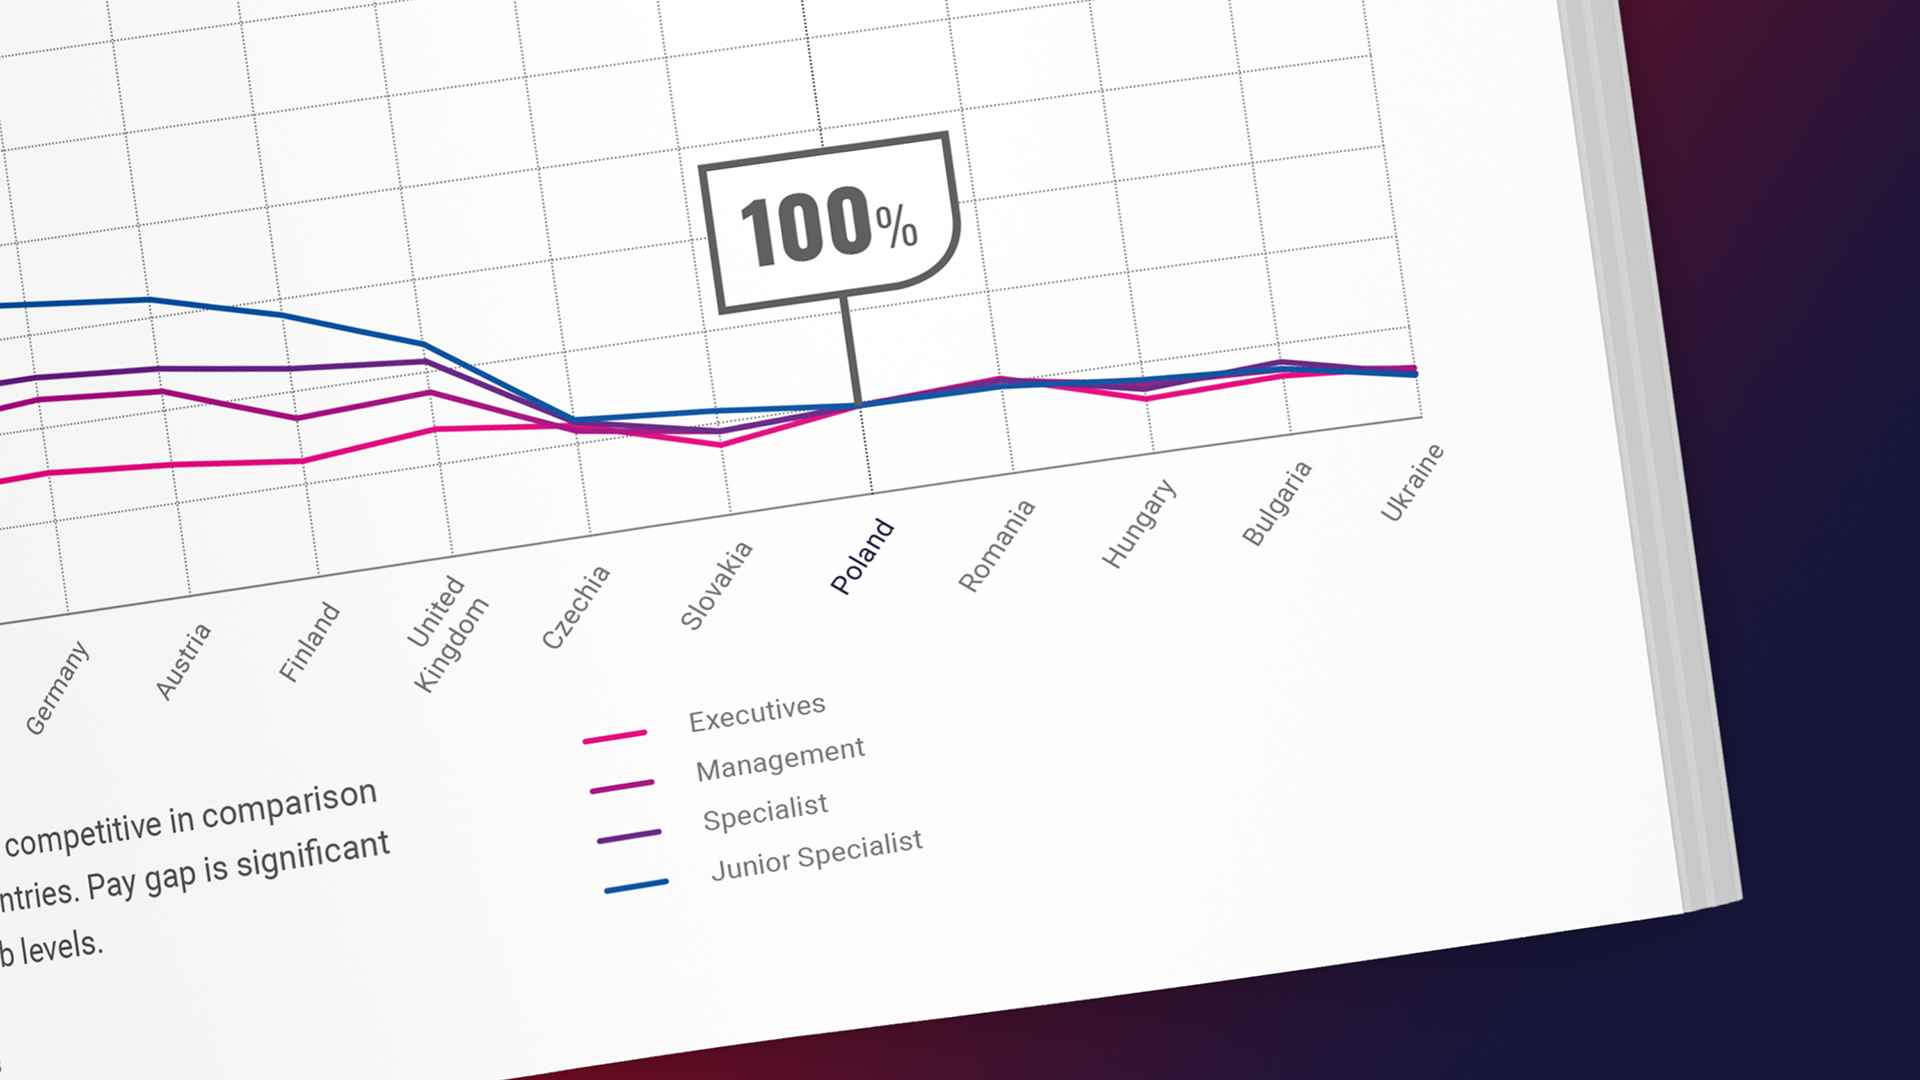
Bare tables and charts undergo a transformation under the watchful eye of our GOOD team. To ensure they look their best, we use infographics, pictograms, graphical data visualizations, eye-catching chart presentations, and other tricks. With us, even a complex, multi-level table gains a friendly, clear, and professional look.
Do you want your report to be a convincing argument, proof of success, or help you achieve your goals? Leave it with us – we will create a tool that will support you both during the presentation and afterward, leaving a lasting positive impression. By sliding the images, you can see how raw content turns into good reports.


About the project
We designed the Business Services Sector in Poland 2023 sector report for ABSL (the Association of Business Service Leaders). This publication was created for the ABSL Summit LEAD THE WAY STAY AHEAD, which took place in September in Kraków. Among the speakers at the event were Anders Fogh Rasmussen, Mark Brzezinski, and Anne Applebaum. The report we prepared for this event contains detailed information and data about Poland’s modern business services sector. Its color palette reflects ABSL’s branding, expanded to a broader scale. The report includes over 100 infographics, tables, and charts, all designed in a cohesive graphic style aligned with the overall layout. The Business Services Sector in Poland 2023 report spans 204 pages and is divided into five chapters, developed with contributions from ABSL, Colliers, Mercer, and Randstad. In addition to designing the report in two language versions — Polish and English — we also managed its printing.

Take a look at the report "live" on our partner's website
Live reportClient’s testimonial
Bare tables and charts undergo a transformation under the watchful eye of our GOOD team. To ensure they look their best, we use infographics, pictograms, graphical data visualizations, eye-catching chart presentations, and other tricks. With us, even a complex, multi-level table gains a friendly, clear, and professional look.
Do you want your report to be a convincing argument, proof of success, or help you achieve your goals? Leave it with us – we will create a tool that will support you both during the presentation and afterward, leaving a lasting positive impression. By sliding the images, you can see how raw content turns into good reports.